


When the Numbers Start Talking: How to Read Your KPIs in GA4
KPIs (key performance indicators) are the core numbers that tell you whether you're hitting your business goals. In GA4, pick the three to five that match your goals, then read the rest of your metrics in three chunks: acquisition, engagement and conversion.
This is part 5 of our Marketing Strategy Basics series. Catch up on part 1 on STP and USP, part 2 on performance marketing, part 3 on conversion rate optimization and part 4 on customer journey maps.
In parts 1 through 4, we built the backbone of marketing: strategy (STP), execution (performance marketing), conversion (CRO) and integration (the customer journey map). But if you never check whether any of it is actually working, you're right back to marketing on gut feel.
A widely used tool for that check is Google Analytics 4 (GA4). The catch is that GA4 shows you a lot of metrics. If you don't know what to look for, it's easy to get lost in the data.
In this post we focus on one question: which numbers should you actually watch? We'll cover how to set KPIs and how to read them in GA4.
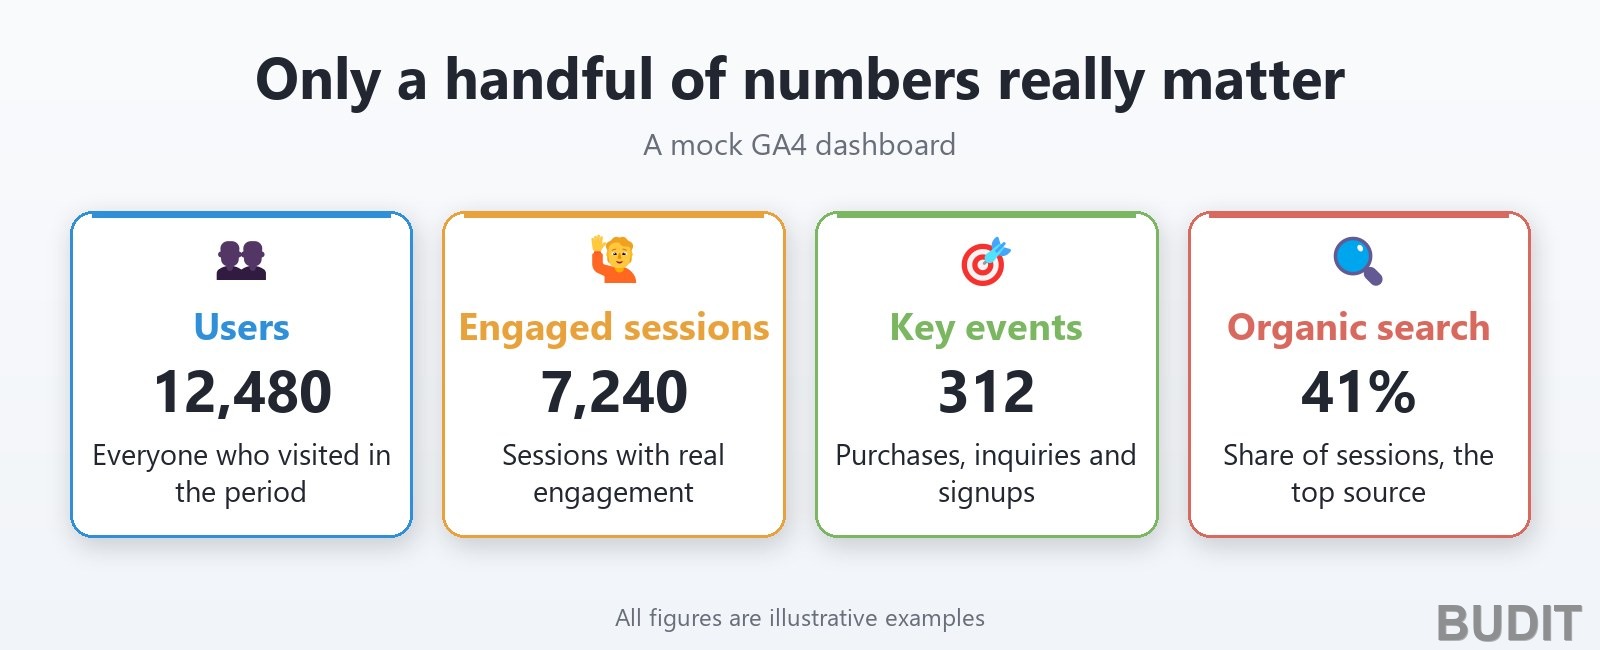
Of all the metrics in GA4, only a handful need to be KPIs. The numbers shown are illustrative examples.
1. KPIs: Picking the Numbers That Really Matter
A KPI (key performance indicator) is a core number that tells you whether you're reaching a business goal. GA4 offers a lot of metrics, but it's best to narrow your KPIs down to about three to five. The rest are either supporting metrics that help explain your KPIs or vanity metrics that don't influence any decisions.
The test for a good KPI is simple: if this number moves, does our next move change? If the number shifts and nobody decides anything differently, it isn't a KPI.
Example KPIs by business type
If you run an ecommerce business, start with revenue, average order value (AOV) and cart abandonment rate. Together, those three show roughly where revenue is leaking. The CRO work from part 3 ties directly into lowering cart abandonment.
For B2B and other businesses built on leads, track the number of inquiries (leads), the rate at which leads become customers and lead quality by channel. A flood of leads means nothing if they never turn into contracts.
For SaaS, watch free trial signups, the rate at which trials convert to paid plans and churn. Here, keeping customers matters more than bringing them in.
Quick tip: set your KPIs in three steps.
- Confirm the business goal. Ask what matters most this quarter: revenue growth, new customers or reducing churn.
- Connect KPIs to it. Pair each goal with one or two KPIs, for a total of three to five.
- Add diagnostic metrics. Choose supporting metrics that will help you find the cause when a KPI slips.
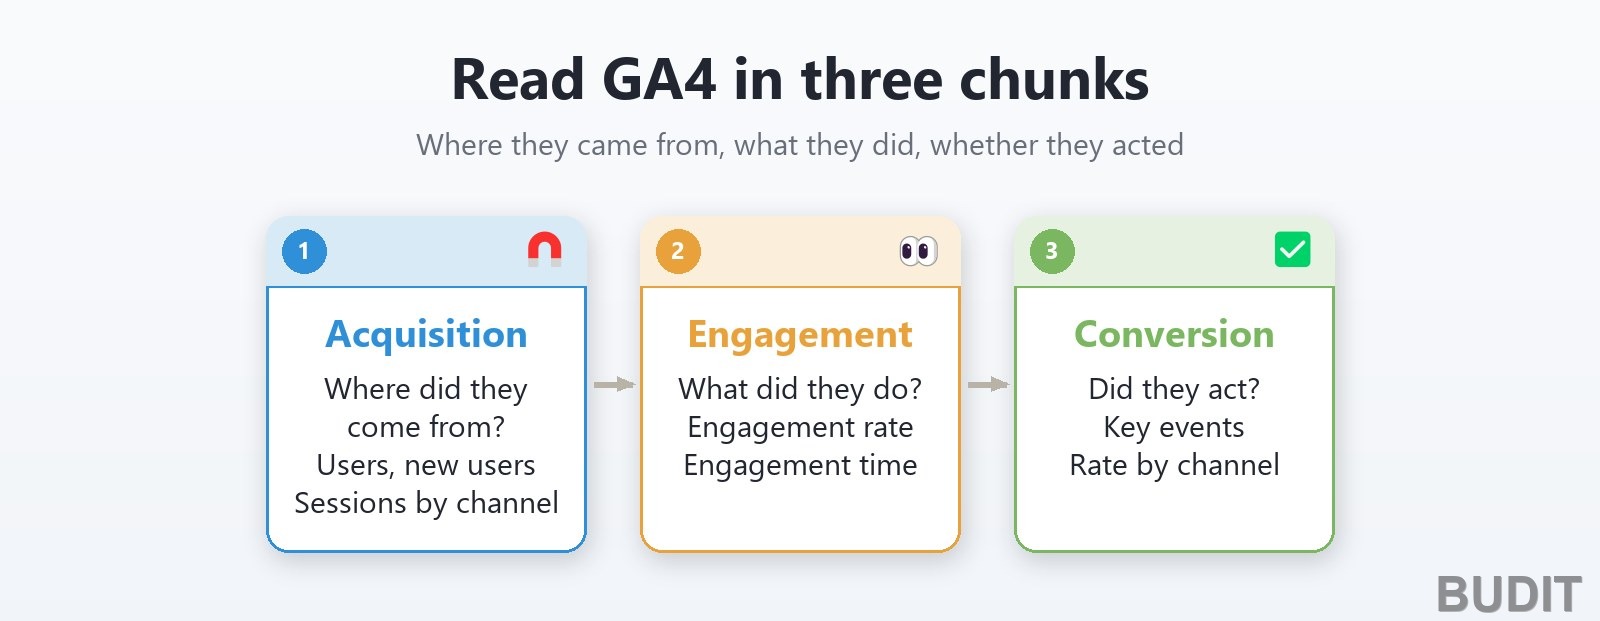
Read GA4 in three chunks: where people came from, what they did and whether they took action.
2. Reading GA4's Core Metrics: Acquisition, Engagement and Conversion
You don't need to memorize every GA4 metric. Just organize them around three questions.
Acquisition: where did customers come from?
Users and New Users show your total number of visitors and how many came for the first time. The performance marketing from part 2 is what moves these numbers.
Sessions by Channel shows which traffic sources bring people in, whether that's search, social, email or direct. Think of it as the report card for the channel budget split we covered in part 2.
Engagement: once they arrived, what did they do?
Engagement Rate is the share of sessions that were engaged. A session counts as engaged if it lasts longer than 10 seconds, has a key event, or has two or more page or screen views. Any one of the three is enough. In GA4, bounce rate is the opposite: the share of sessions that were not engaged.
Average Engagement Time tells you whether the content you placed along the journey in part 4 is actually being read. If people leave quickly, your content isn't matching what they expected.
Conversion: did they take action?
Key Events are the actions you choose to count as conversions in GA4. Mark the actions that matter most to your business, such as completed purchases, contact form submissions or free trial signups, as key events.
Conversion Rate by Channel is the final report card for your performance marketing from part 2. A channel that drives plenty of traffic but doesn't convert needs its budget reallocated.
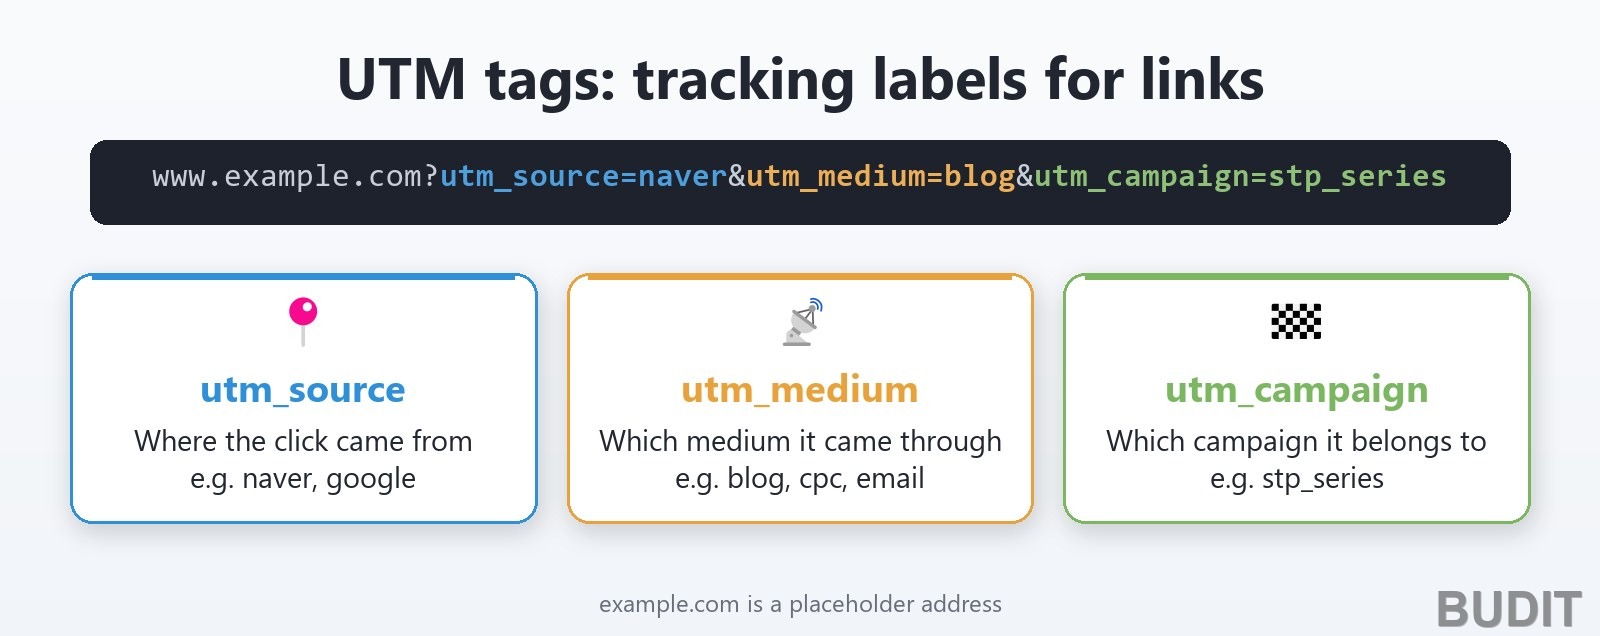
UTM parameters: the tracking tags that show which ads actually worked.
3. UTM Parameters and Setup: Building a Structure Where Data Adds Up
However good GA4 is, you can't analyze data that isn't being collected properly. A common problem is traffic landing in Direct or Unassigned. A frequent cause is ads and outside links that carry no UTM parameters.
UTM parameters are tracking codes added to the end of a URL. They tell GA4 where the person who clicked came from (source), through which medium (medium) and through which campaign (campaign).
Here's an example:
www.example.com?utm_source=naver&utm_medium=blog&utm_campaign=stp_series
A visitor who clicks this link shows up in GA4 as coming from the STP series campaign on a Naver blog (Naver is Korea's largest search portal).
Setup checklist
- Set up events. In the Admin area of GA4, register your core business actions (purchases, inquiries, signups) as events, and mark them as key events.
- Standardize your UTM rules. Everyone on the team needs to follow the same naming convention. If
naver_blogandNaver_Blogget mixed together, the same channel is counted as two separate values. We recommend sticking to lowercase and underscores. - Use GA4 Explorations. Beyond the standard reports, set up funnel and path explorations in Explore so you can check the customer journey map from part 4 against real data.
The data connection across touchpoints that we stressed in part 4 becomes real through UTM tags and GA4 event setup. Only when a customer's path from blog post to ad click to inquiry is tracked as a single data flow can you answer the question that matters: which content actually contributed to revenue?
Wrapping Up
Data analysis isn't the end of marketing. It's a fresh starting point for revising and improving your strategy. Look back over parts 1 through 5 and you'll see a complete loop:
- Part 1, STP and USP → strategy: who you serve and what value you offer
- Part 2, performance marketing → execution: which channels and how much budget
- Part 3, conversion rate optimization → conversion: turning visitors into customers
- Part 4, customer journey maps → integration: the whole experience through the customer's eyes
- Part 5, GA4 and KPIs (this post) → measurement: check the results with data, then go back and refine the strategy from part 1
This is the basic loop of marketing driven by data. In part 6, we look at growth hacking and the AARRR framework, which help you run this loop faster.
Work with Budit
Installed GA4 but not sure what to look at? Get in touch with Budit. We'll look at KPI setup, dashboards and performance by channel with you.
References
- Google Analytics Help, "[GA4] Engagement rate and bounce rate": definitions of engaged sessions, engagement rate and bounce rate, support.google.com/analytics/answer/12195621 (accessed September 17, 2026)
- Part 1: Stop Marketing on Gut Feel: Building Your Marketing Backbone With STP and USP
- Part 2 of this series, on performance marketing
- Part 3 of this series, on conversion rate optimization (CRO)
- Part 4 of this series, on customer journey maps